How to Build an Effective Pricing Strategy

In an environment marked by sustained inflation and instant online price comparisons, a robust pricing strategy has become a cornerstone of commercial competitiveness. But how can retailers align prices against competitors while protecting profit margins and maintaining a positive price perception? Which key metrics should commercial teams track? How can businesses optimize prices dynamically using real-time market data?

In this guide, we break down the core pillars of an effective pricing policy, covering price alignment models, price index tracking, and psychological pricing.

Dynamic Pricing

1. What Is a Pricing Strategy?

A pricing strategy refers to the framework and methodology a business uses to set selling prices according to its commercial goals: market share expansion, bottom-line profitability, customer perception, or competitive positioning.

An effective strategy relies on four main pillars:

  • Competitive price alignment

  • Perceived price perception (price image)

  • Data-driven pricing optimization based on market dynamics

  • Psychological pricing tactics

2. Competitive Price Alignment: A Double-Edged Sword

Price Alignment Strategy: Definition

A price alignment strategy involves adjusting your prices relative to direct competitors. Commercial teams typically adopt one of three alignment models:

  • Strict alignment: Matching competitor prices exactly (Price Index = 100).

  • Slight undercutting: Positioning strategic products 2% to 5% below key rivals to capture demand without destroying profitability. 

  • Price leadership: Consistently offering the lowest price on market defining references (high volume traffic drivers).

The Risks

Margin erosion: Reducing prices without monitoring underlying cost structures or supplier terms

Destructive price wars: Uncontrolled, fully automated race to the bottom undercutting loops.

💡 Best Practice: Avoid aligning your entire catalog. Focus price adjustments on high visibility SKUs (KVIs, top sellers, paid search targets), while maintaining higher margins on differentiated or exclusive references.

3. Price Perception: The Underrated Asset

Your price perception (or “price image”) is the overall impression consumers hold regarding your price levels. It is heavily influenced by:

  • KVI products (Key Value Items: high-visibility, frequently purchased SKUs)

  • Prominent prices on landing pages and digital ads

  • Price consistency across product ranges

  • Pricing transparency (e.g., clear unit pricing and delivery fees)

Target: Mastering Your Price Index

A price index measures the average gap between your prices and market rates across a specific product category. For example:

  • Price Index 98: Your prices are, on average, 2% lower than your competitors.

4. Pricing Optimization: Data, Elasticity, and Tools

Modern pricing optimization relies on real-time data analysis:

  • Automated competitor price tracking

  • Monitoring competitor stock availability and out-of-stock events

  • Price elasticity modeling (measuring how volume responds to price changes)

  • Ad Spend Optimization (excluding non-competitive SKUs from Google Shopping/PMax campaigns)

Example: A product priced at a psychological threshold of £9.99 can see conversion rates drop significantly if bumped to £10.10, despite the minimal nominal difference.

5. Psychological Pricing: An Overlooked Lever

Psychological pricing leverages consumer behavior and perception rather than pure cost-plus calculations:

  • Charm pricing (.99 / .95 endings): Creating a threshold effect that makes prices appear lower.

  • Comparative pricing: Displaying strike-through prices to highlight perceived value.

  • Anchoring effect: Showcasing a premium model to make a mid-tier option feel more affordable.

Example: A kitchen appliance priced at £599 feels like a great deal when displayed next to a £999 flagship model, even if the higher-priced item is rarely sold.

6. How Retail Shake Helps Drive Your Pricing Policy

Using an advanced competitor price tracking and market intelligence platform enables commercial teams to:

  • Track real-time price index benchmarks across categories, brands, and competitors.

  • Execute targeted price alignment on strategic traffic-driving SKUs.

  • Identify uncompetitive or overpriced products instantly.

  • Automate ad feed management by pausing ad spend on non-competitive items

    .

7. Best Practices for Building a Sustainable Alignment Policy

Action Objective Tool / Feature
Track identical SKUs Adjust prices exclusively on like-for-like products EAN / GTIN Matching
Identify traffic drivers Build price perception on high-visibility references Visibility Scoring
Monitor rival promotions Anticipate promotional moves and market shifts Promotional Calendar Tracking
Evaluate average price index Maintain overall category positioning and margin health Price Index Dashboards

E-Commerce Product Matching and Private Label: Building Reliable Retail Competitive Data

Tracking branded FMCG products across channels relies on standardized GTINs and EAN barcodes. Direct SKU mapping is straightforward.

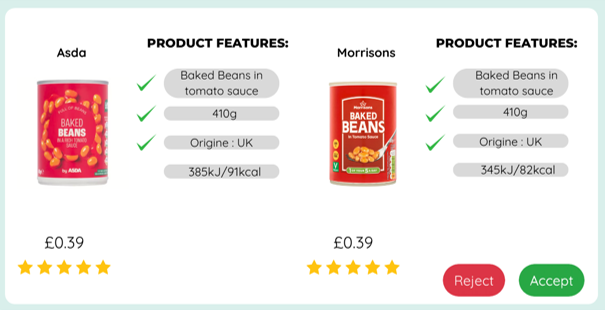
However, cross-retailer benchmarking breaks down when dealing with two critical areas: e-commerce product matching without unique identifiers and Private Label (Own Brand) price tracking. In competitive markets like the UK and Continental Europe, mastering both is essential to protect market share and secure margins.

Recherche visuelle - produits similaires miroirs

Technical Challenges of Non-EAN Product Matching


Product matching links identical or directly substitutable SKUs across different sales channels. When EANs are missing, internal, or intentionally masked by competitors to prevent web scraping, traditional extraction tools fail.

To prevent mispriced matches, enterprise-grade retail data platforms evaluate multiple weak signals to reconcile product catalogues:

  • Semantic similarity: Cross-referencing titles, product descriptions, and category taxonomy.

  • Attribute normalization: Converting units and formats (e.g., mapping 75cl to 0.75L or normalizing multi-packs).

  • Computer Vision: Matching pack graphics and shelf presentations despite variations in image angles or lighting.

Key Takeaway: Poor matching algorithms lead to high false-positive rates (e.g., matching a single item against a 6-pack). Implementing advanced visual product matching ensures pricing strategies rely on strictly equivalent data points.

Private Label Benchmarking: UK & European Market Dynamics

In the UK, price competition between traditional grocers (Tesco, Sainsbury’s, Asda) and discounters (Aldi, Lidl) hinges on Own Brand ranges and aggressive “Price Match” campaigns.

Benchmarking Private Label products,from fresh food to ambient groceries, requires navigating several technical hurdles:

  • No shared EANs: Every retailer operates on internal item codes.

  • Pack size variations: Ingredients, packaging, and net weights differ (e.g., comparing a 400g item with a 500g variant).

  • Tier alignment: Products must be matched across equivalent tiers (Entry-level / Value, Core, Premium / Finest) for benchmarks to deliver meaningful insights.

Manual matching across thousands of Private Label SKUs is slow, costly, and prone to human error. Modern private label strategy relies on functional equivalence rules, dynamically normalizing prices by weight, volume, or tier position while factoring in live stock availability.

Automate Matching to Drive Category Performance

Managing Private Label pricing and non-EAN product matching through manual audits or static spreadsheets is no longer viable. To execute precise pricing strategies across the UK and European markets, retail teams require automated matching engines designed for the realities of modern retail data.

Why Data Quality Is the Bedrock of Competitive Pricing

Data quality is far more than a technical checkbox; it’s a strategic imperative. In modern retail, accurate data underpins every smart decision, powers reliable analytics, and protects businesses from costly pricing blunders.

Before using market data to adjust prices or guide strategy, you need absolute confidence in its accuracy.

Data quality isn’t just about technical precision—it’s about business relevance. Inaccurate or stale data doesn’t just hurt operational performance; it erodes your brand’s credibility and bottom line.

To keep data reliable, we rely on two core sets of guardrails:

  • Technical rules: These check the intrinsic health of the data—completeness, accuracy, and freshness.

  • Business rules: These ensure the data makes sense in a retail context, validating its functional value, consistency, and usability for commercial teams.


In Conversation with Gregory, Data Expert at Retail Shake

Why is data quality so critical when it comes to competitor price tracking?

Gregory: Our clients rely on our insights to make high-stakes commercial decisions. If the data isn’t spot-on, they can’t act with confidence.

How does Retail Shake guarantee the accuracy of its data?

Gregory: Beyond manual audits at every stage of the data pipeline, we built an internal verification engine called Datacrop. It performs automated sanity checks right before data is written to our database.

Which data quality KPIs do you track, and how do you refine them?

Gregory: We keep a close eye on the volume of items scraped by each spider, using sector-specific visual dashboards during our daily checks. We’re currently moving towards even finer granularity to better benchmark our collection runs.

What does your data quality lifecycle look like in practice?

Gregory: It follows a strict four-step workflow:

1. Local scraping tests on a limited scope.

2. Automated test scripts for every individual spider.

3. Dedicated monitoring dashboards to track volumes visually.4. Continuous QA and extraction health checks.

Can you share a real-world example where data quality paid off for a client?

Gregory: Take our enterprise client Leroy Merlin. They use Retail Shake to shape their pricing strategy and automatically update electronic shelf labels in-store. Here, data accuracy directly impacts the price tags customer see on the shop floor every day.

How do you handle missing or dirty data?

Gregory: If a key attribute like an EAN/GTIN is missing, we enrich the product record by cross-referencing alternative sources.

For dirty data, our Datacrop layer sits between extraction and ingestion to clean and normalize values. For example, different retailers list weights differently (“kg” vs “kilogram”). Datacrop standardizes these attributes on the fly so everything matches seamlessly.

What’s the biggest data hurdle for retailers, and how do you solve it?

Gregory: Benchmarking Private Label (Own-Brand / MDD) ranges is always the hardest part because there are no shared EANs. We solved this with an intuitive, Tinder-style matching tool that pre-selects candidate products, making cross-retailer comparisons effortless for Category Managers.

How does high-quality data drive customer trust and retention?

Gregory: When data is consistently reliable, it shows you truly understand the client’s business. Clients feel confident, adopt the platform more deeply, and suggest new features—which feeds right back into our product roadmap.

How do you ensure full data transparency and traceability?

Gregory:

  • Transparency: Clients access their data either directly through the Retail Shake app or via raw data exports. Whichever they choose, they can always see the exact source and collection timestamp.

  • Traceability: Every single data point is timestamped and audited. We know precisely which spider scraped it, when it ran, and when it was last updated.

What tech stack do you use to maintain data integrity?

Gregory: I’m currently testing dbt-core to automate data testing against strict business requirements. The data ecosystem is moving fast, so staying ahead of the curve is part of the job.

Any recent tech innovations you’ve rolled out?

Gregory: We recently launched a pre-production environment for our task orchestrator (Apache Airflow) for client exports. This allows the engineering team to run full QA checks before pushing data live.

It also acts as a sandbox to test new automation tools. For instance, I recently helped our CSM, Hannah, set up Selenium IDE so she can record and replay site verification routines without doing manual checks.

How Does a Retail Repricing Engine Work?

Today, a Category Manager or a Pricing Analyst can be responsible for tracking thousands of SKUs across multiple product categories. At the same time, competitor prices shift daily, promotional campaigns multiply, and key references can become high-priority targets overnight.

This is precisely where a retail repricing engine comes into play: transforming vast amounts of raw market data into actionable, risk-managed pricing recommendations for commercial teams.

What Is a Repricing Engine?

A repricing engine is a software solution designed to analyze competitor market data and generate pricing recommendations based on pre-defined business rules.

Its purpose isn’t simply to race to the bottom by automating price cuts. Instead, it highlights specific product lines that require human intervention or algorithmic adjustments. Depending on an organization’s tech maturity, these recommendations can be pushed automatically (via direct API integration into your ERP) or submitted for one-click manual approval.

Clean Data: The Essential Foundation for Effective Repricing

A pricing optimization tool is only as good as the data feeding it. If your current monitoring tools capture dirty data such as scraping anomalies or tracking blind spots that obscure true market dynamics, your pricing decisions will be inherently flawed.

However, the most critical vulnerability remains product matching accuracy:

Real-World Example: Tracking a “Pack of 6 Alpro Almond Milk cartons” and accidentally matching it against a “Single Carton” due to missing or incorrect EAN codes on a competitor’s site.

A product matching error instantly triggers absurd pricing recommendations, damages your price perception, and destroys profit margins. This is where basic web scrapers fall short compared to an advanced competitive intelligence platform. A robust engine cleans data at the source and guarantees exact item matching, even when EAN/GTIN codes are absent.

Business Rules: The Brain Behind the Engine

Once market data is collected and normalized, the engine executes your commercial strategies. You retain total control. Common automated repricing rules include:

  • Indexation & Market Alignment: Match Competitor X directly, or maintain a strict $x\%$ price index above or below them.

  • Margin Floor Protection: Never drop below a designated gross margin threshold, regardless of competitor aggressiveness.

  • Stock-Aware Pricing: Raise selling prices automatically if the top 3 competitors go “Out of Stock”.


Price Simulations: Testing Strategies Before Going Live

Advanced repricing engines do far more than suggest new price points: they feature built-in price simulation modules.

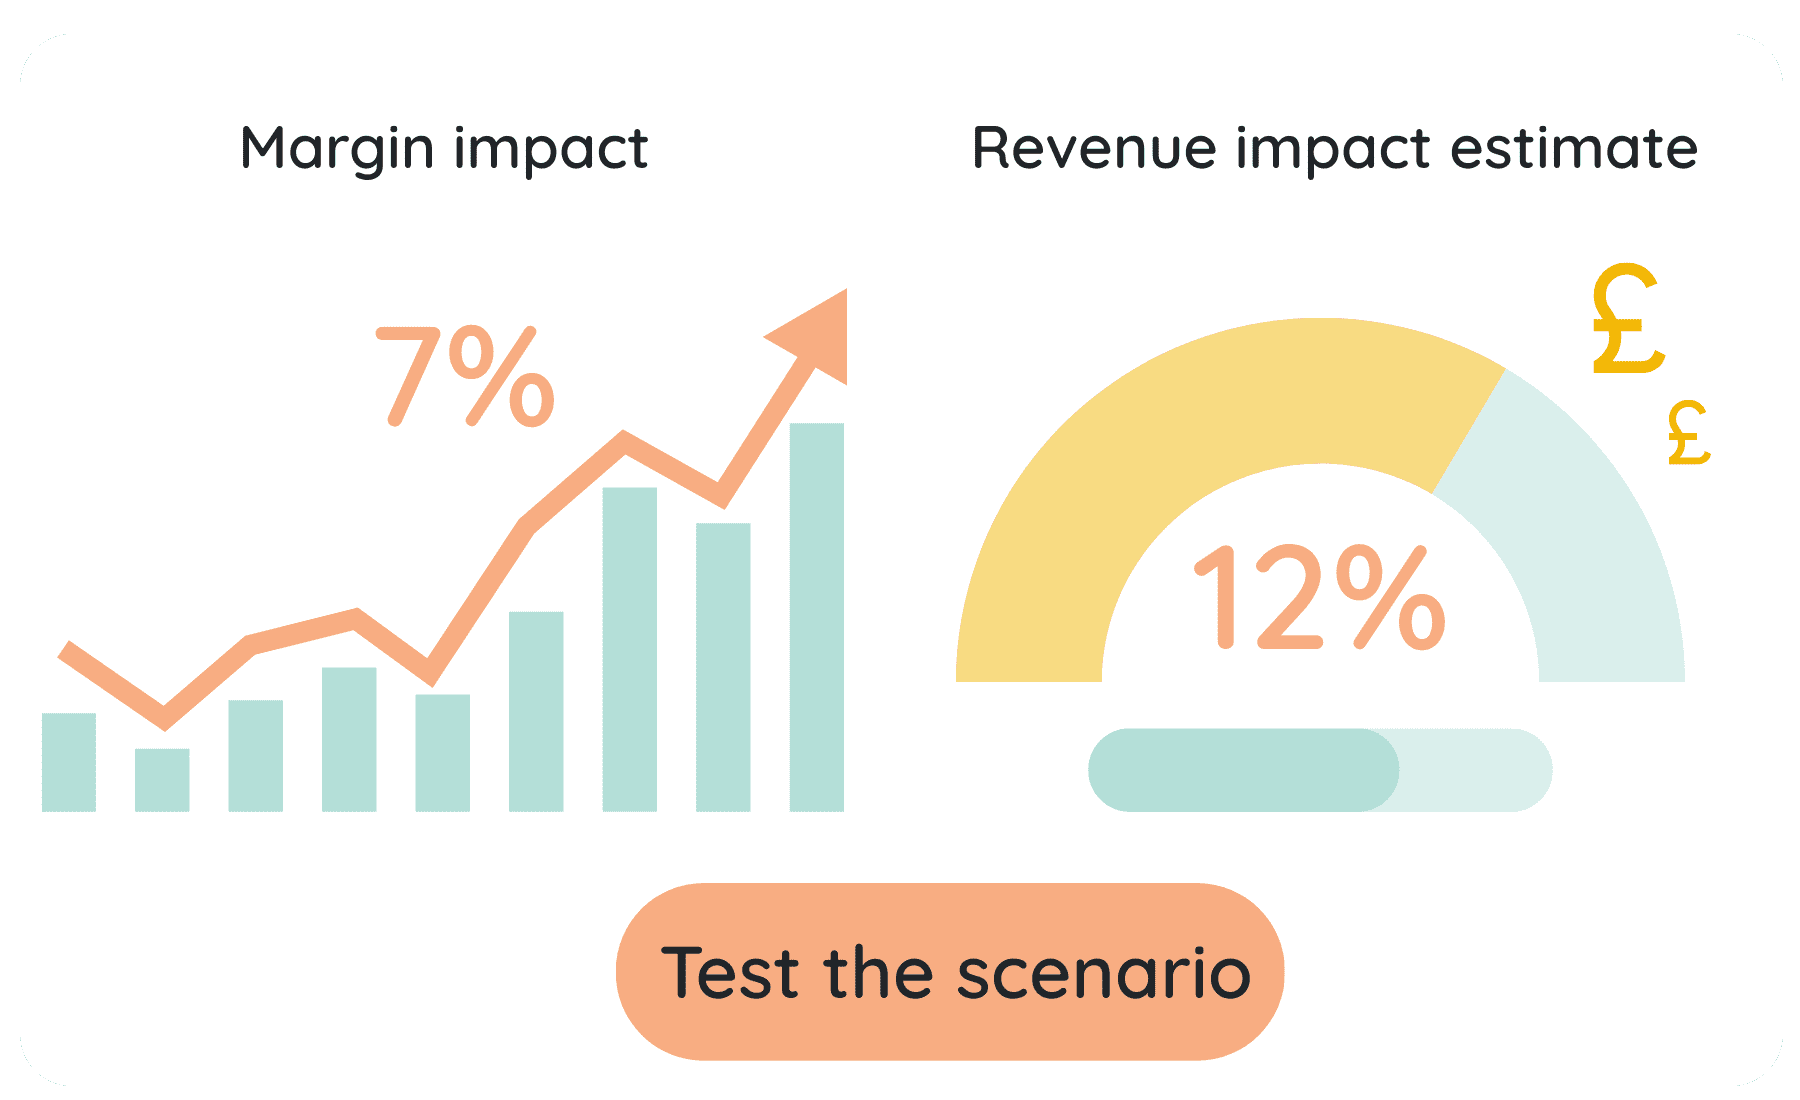
Before deploying a massive price update across 5,000 SKUs ahead of a major peak trading event or promotional season, the platform allows you to simulate the theoretical impact on revenue and overall bottom-line profitability. This eliminates panicked, reactive price edits triggered by aggressive competitor moves.

REPRICING - Simulator

Conclusion

A retail repricing engine doesn’t replace the commercial expertise of Pricing Managers, it amplifies it. By automating data collection, data cleaning, and business logic execution, it frees up valuable time for high-level strategic analysis and vendor negotiation.

To learn more about building your strategy on reliable data, read our complete guide on Product Matching and Private Label (Own-Brand) Price Tracking.

Digital distribution and value distribution: the main KPI’s of mass consumption

Digital distribution and value distribution: the main KPI’s of mass consumption

Analyzing the performance of a product can be achieved from several angles. One of the most important aspects remains distribution nonetheless. Measuring this involves calculating two major indicators: digital distribution and value distribution.


How to work out digital and value distribution?


Digital distribution (DD) gives you the rate of presence of a product in available points of sale. As such, it corresponds to the number of stores in which the product is found on the shelves. In its equivalent percentage DD is connected to the total number of points of sale offering goods in the specific category. DD lets you know the “quantity” of products made available in stores: https://www.retailshake.com/2021/05/distribution-numerique-le-kpi-de-la-grande-distribution/


Value distribution (VD) also corresponds to the percentage of points of sale in which the product can be found, except that the weight of stores in the calculation is adjusted according to their importance, revenue and sales volume. Major retail distributors will therefore have greater weight in the percentage than grocery stores for example. VD is therefore used to find out the “quality” of a product’s provision.

These two indicators are useful for analyzing commercial performance.

Using KPI’s, such as digital distribution or value distribution, is only really useful if they are combined. Together, they help us to know the product’s coverage in a distribution network and therefore to know whether a product is offered to consumers to a sufficient degree to generate a satisfactory level of sales.


When DD is higher than VD, this means that the product is available in a large number of points of sale, but principally in stores which are small or of minor importance. If the opposite is true, the product is only accessible in a small number of points of sale, but these represent a relatively large proportion of overall sales. Generally speaking, a company will strive for the latter scenario. While a good ratio between DD and VD is important to know the quality of the product referencing, it is also useful for planning the marketing strategy. For example, the company may waste money if it opts to launch its communication campaign at a time when the product is not yet sufficiently available to consumers. Furthermore, knowing a product’s DD and VD is vital in order to take corrective measures regarding its distribution.


Retail Shake, your competitive intelligence monitoring tool 


One of the issues facing companies when it comes to calculating digital distribution and value distribution is the lack of up-to-date and relevant information about points of sale. With Retail Shake, you can access data in real time from thousands of stores throughout France. In this way, you can track the deployment and availability of your products or those of your competitors without worrying about the information received being unreliable. Thanks to the interactive map, you can select the retailer of your choice and browse the different points of sale, to know which ones sell a given product and how much stock is available, and all in just a few minutes. You can also use filters to choose the retailers of interest to you, according to the criteria you have defined.


Quality of life in the workplace – a core element of corporate social responsibility.

Quality of life in the workplace – a core element of corporate social responsibility.

Quality of life in the workplace has become a central issue for human resource departments. However, this complex concept is not always easy to determine or to incorporate. Nonetheless, over the last few years, humans have occupied an increasingly central role in our companies. It is therefore logical for companies to take an interest in the role of the men and women in their organization.

Latest trends show that implementing a QLW vision and strategy offers multiple benefits. The wellbeing of employees can also offer interesting opportunities for development and performance.

But how do you move from theory to practice?

Quality of life in the workplace What do we really mean?

A QLW policy is, first and foremost, a collective company project. The aim is to enhance the quality of life of the various players in the organization. The feeling of wellbeing in the workplace sought through the implementation of QLW is therefore reliant on several factors, such as the organization, the corporate culture, relationships, development and work-life balance.

QLW was recognized as a strategic challenge by the 2013 French National Inter-Professional Agreement [Accord national interprofessionnel] and described as:

“The conditions under which employees do their work, and their ability to give their opinion about and be empowered in said work, forming the perception of the quality of life in the workplace which results from this”

In other words, quality of life in the workplace is defined as all the factors which have an impact on employees’ working experience. The concept meets employees’ goals for satisfaction and the improvement of working conditions.

Individuals are placed at the heart of this definition because their quality of life in the workplace is influenced by a large number of factors including:

          Quality of undertaking at all levels of the company

          Quality of the physical environment

          Quality of the information shared within the company

          Quality of work content

          Quality of social and working relationships 

          Quality of work organization 

          Possibility to reconcile professional and personal life 

          Possibility for personal development 

A collective approach

The QLW policy cannot be considered as being isolated from company projects. On the contrary, it is a source of reflection for the various projects and processes underway. More than a ‘new’ policy, it involves adding coherence to actions already undertaken, by placing an onus on employees’ expression and participation.

A 10 to 12% productivity gain can be expected among employees who are happy at work according to cadremploi.

Quality of life in the workplace is therefore becoming a collective company policy. Its implementation addresses several major issues, in particular in the areas of:

          Employee engagement

          Health and safety in the workplace 

          Digital transformation 

          Retaining employees

          Enhancing working conditions 

This overall strategic corporate policy aims to analyze real workplace situations in order to improve them.

Quality of life in the workplace a performance lever

Companies which choose to place people at the center of their strategy will notice that it serves as a powerful lever of innovation, engagement and performance. Indeed, only 6% of employees are engaged in their work (source: myhappyjob). However, if we create a ‘wellbeing’ environment based on dialogue, respect, trust and attentiveness, employees become more loyal and defend their company.

QLW does not confine performance to a merely quantitative or production-driven vision. It is part of a positive and sustainable approach, linked to social and human objectives, and directed towards long-term economic effects.

Spending one euro of capital on QLW brings thirteen euros of profit for the company. Quality of life therefore brings a win-win momentum and because it offers greater and lasting efficiency, it also benefits employers.

Many studies aim to demonstrate that a close link exists between quality of life in the workplace and performance and these are often showcased by training bodies and associations (cegos, terra nova, etc.)

In other words, by introducing QLW in your company, you can turn work into a source of fulfilment and good health and boost competitiveness.


“Quality and innovation are connected and mutually beneficial”, Armand V. Feigenbaum

QLW at Retail Shake

At Retail Shake, placing people at the center of organizations to build a fulfilling and sustainable future is a real corporate vision. We don’t consider this as an ideal but rather as a genuine return on investment. It is a collective company project. We have chosen to offer our employees a working environment in which fulfilment and wellbeing come as standard. We are convinced that happy employees are more efficient than those who find their environment stressful. At Retail Shake, we know that trial and error are needed in order to progress. We also choose to work together to understand everyone’s professions, to enhance exchanges and to optimize work time. Our offices are laid out to ensure everyone feels at home and a number of team activities are organized to maintain good cohesion. We also strive to reward every successful challenge. Our employees’ happiness makes Retail Shake a success!