
Marketplace Strategy: How Brands Detect, Prioritise, and Drive Performance

Online marketplaces have become an essential growth lever for brands and retailers seeking to expand their digital reach and drive incremental revenue. However, with highly fragmented seller networks spread across multiple channels, standing out from the competition requires active oversight.

Understanding who is selling your products, on which platform, and at what price is critical to protecting your margins. Here is how modern commercial teams detect market opportunities, prioritize actions, and drive multi-channel performance.

Navigating the Complexity of Modern Online Marketplaces

Managing product listings across third-party channels introduces major operational challenges. Commercial and pricing teams often lack a unified, real-time view of their broader ecosystem, leading to delayed decision-making.

Winning on a marketplace requires answering three fundamental questions faster than your competitors:

1. Assortment: Which high-demand SKUs are currently missing from your target channels?

2. Seller Network: Which unauthorized third-party merchants are undercutting your recommended retail price (RRP)?

3. Positioning: How do your landed costs (item price plus shipping) compare across competing storefronts?

Read more: Learn how to track equivalent items without EAN codes in our guide on advanced product matching

        Two Distinct Roles, Two Data Needs

        To maximize overall performance, commercial organizations must cater to two distinct internal functions:

        1. Marketplace Business Developers

        Business Developers focus on expanding catalog breadth and onboarding high-value merchants. Their goal is to identify catalog gaps, benchmark seller performance, and prioritize high-margin category expansion.

        2. Key Account Managers (KAMs)

        KAMs monitor active merchant compliance and performance. They focus on tracking price fluctuations, optimizing Buy Box win rates, and identifying discrepancies in shipping costs or delivery speed to protect overall brand equity.

        Building an Actionable Data Monitoring Framework

        Relying on manual platform checks is unscalable across hundreds of merchant listings. To maintain control over your digital shelf, brands require structured data monitoring.

        Monitoring Pillar Key Metric Tracked Strategic Objective
        Pricing Intelligence Landed price (Product + Shipping) Maintain price parity & avoid margin erosion
        Buy Box Ownership Win rate percentage per SKU Maximize sales conversion on top channels
        Merchant Tracking Fulfillment speed & stock availability Eliminate stockouts & unauthorized sellers
        Cross-Channel Benchmarking Category visibility & share of voice Identify underperforming product categories

        Mastering Buy Box Mechanics and Competitor Tracking

        Securing prominent placement on a major marketplace depends heavily on winning the Buy Box. Algorithms evaluate multiple variables beyond the base listing price, including shipping fees, delivery timelines, seller ratings, and stock reliability.

        Automated competitor tracking enables commercial teams to isolate these variables. By analyzing total landed costs across competing platforms, brands can refine their pricing algorithms, enforce partner compliance, and capture high-intent buyers.


        Transforming Marketplace Operations into a Growth Engine

        Managing a modern online channel is no longer just about tracking completed transactions; it is a data-driven discipline.

        By centralizing cross-channel intelligence, automating merchant alerts, and systematically optimizing listing visibility, retailers shift from reactive channel management to proactive market dominance.
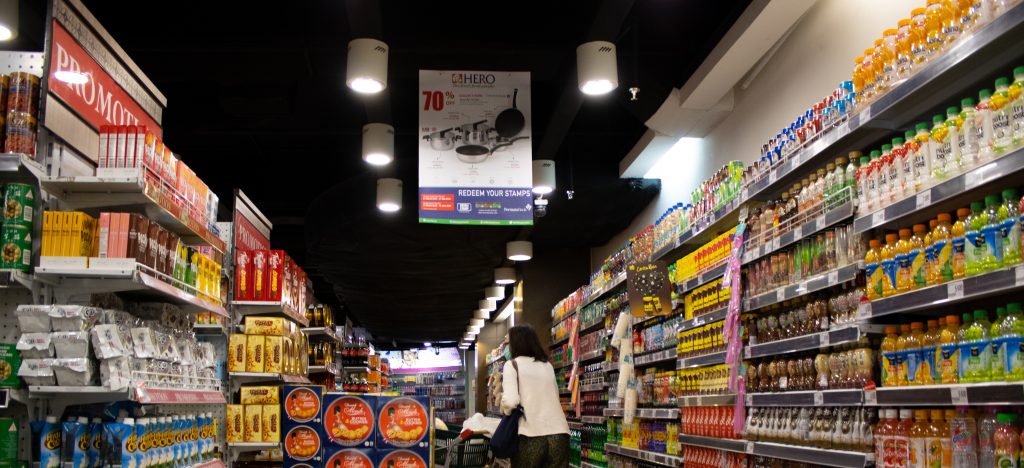

        Explore how Retail Shake’s marketplace tracking software provides complete visibility across all your target sales channels.

        Weighted Distribution: Definition, Formula, and Retail KPI Guide

        Understanding weighted distribution is essential for brand manufacturers and commercial managers aiming to optimize their retail footprint. In fast-moving consumer goods (FMCG), securing shelf space is not just about being present in many stores, but about being stocked by top-performing retailers with high market share.

        Measuring weighted distribution allows businesses to evaluate distribution quality, assess store sales potential, and refine retail listing strategies.

        Illustration Distribution Valeur

        In the UK, price competition between traditional grocers (Tesco, Sainsbury’s, Asda) and discounters (Aldi, Lidl) hinges on Own Brand ranges and aggressive “Price Match” campaigns.

        Benchmarking Private Label products,from fresh food to ambient groceries, requires navigating several technical hurdles:

        • No shared EANs: Every retailer operates on internal item codes.

        • Pack size variations: Ingredients, packaging, and net weights differ (e.g., comparing a 400g item with a 500g variant).

        • Tier alignment: Products must be matched across equivalent tiers (Entry-level / Value, Core, Premium / Finest) for benchmarks to deliver meaningful insights.

        What Is Weighted Distribution in Retail?

        In FMCG analytics, weighted distribution (also called numeric availability by value or numeric value distribution) measures the total sales volume of the stores carrying a product relative to the total sales volume of the entire category across all stores.

        While basic store counting measures sheer presence, weighted distribution evaluates store quality. For instance, if a smartphone brand tracks its placement in the market, relying on retail measurement standards helps determine whether its products are sold in top-tier electronics stores generating major category revenue or in low-volume outlets.


          How to Calculate Weighted Distribution


          Calculating weighted distribution involves comparing category sales of active stockists against total category sales across the entire market. Expressed as a percentage, the formula reflects overall market coverage:

          Weighted Distribution (%) =
          Category Sales in Stores Carrying the Product Total Category Sales Across All Stores
          × 100

          A high percentage confirms that a product is present in retail outlets with significant commercial potential, ensuring higher revenue generation.

          Comparing Weighted Distribution and Numeric Distribution

          Evaluating retail strategy effectively requires comparing weighted distribution with numeric distribution. These two key performance indicators deliver complementary insights:

          • Numeric Distribution (ND): Measures the percentage of total retail stores carrying a specific product, regardless of store size or sales volume.

          • Weighted Distribution (WD): Measures the sales weight of those specific stores within the overall product category.

          The primary strategic objective for sales teams is achieving a weighted distribution value higher than the numeric distribution value.

          For example, if a perfume brand records a numeric distribution of 20% and a weighted distribution of 80%, it indicates that although only 20% of retail stores stock the fragrance, those specific stores account for 80% of total industry revenue. This demonstrates highly efficient listing performance in key sales channels.

          Key Benefits of Tracking Weighted Distribution

          Consistently monitoring weighted distribution metrics delivers several operational advantages:

          • Identifying Top-Performing Retail Channels: Prioritizes sales efforts toward high-potential store accounts.

          • Evaluating Listing Agreements: Assesses whether new retailer contracts deliver expected commercial growth.

          • Preventing Revenue Loss: Pinpoints distribution leaks in major retail accounts before sales decline.

          Read more: Discover how clean, normalized data improves retail monitoring accuracy in our guide on retail data quality.

          Optimize Your Retail Distribution Strategy Today

          Analyzing weighted distribution enables commercial and brand management teams to move beyond basic store counts and focus on high-yield distribution channels. Integrating accurate shelf intelligence ensures products remain visible where target consumers shop most.

          See also: Learn how to combine distribution metrics with dynamic pricing strategies in our guide on how a retail repricing engine works.

          Private Labels & Inflation: How Retailers Drive Loyalty with Comparable Products

          Over recent years, global economic shifts have put unprecedented pressure on household budgets across the UK and Europe. Among the most direct consequences for everyday consumers is sustained inflation, driving prices higher and forcing families to reconsider their spending habits.

          In this tight economic climate, Private Labels (also known as Own Brands or Store Brands) have emerged as key growth drivers. Offering cost-effective and high-quality alternatives, private labels allow budget-conscious shoppers to stretch their income without sacrificing standard of living.

          For retailers, private label ranges are no longer just budget options; they represent a market generating tens of billions in revenue that continues to expand rapidly.

          The Economics Behind the Own-Brand Surge

          Consider a basic household staple, such as a tin of soup or a loaf of bread. On modern supermarket shelves, private label variations are often priced significantly lower than their national brand equivalents. In a market where every penny counts, this price differential drives immediate shifts in consumer behavior.

          Market data reflects this reality: store brands have captured substantial market share growth across major FMCG categories. This success stems from three primary drivers:

          • Competitive Pricing: As living costs rise, price sensitivity increases. Own labels provide an immediate solution for shoppers seeking savings on daily essentials.

          • Elevated Quality Standards: Private labels are no longer associated with low quality. Major UK retailers have heavily invested in product reformulation and premium packaging, allowing store brands to directly rival national brands in taste, sourcing, and design.

          • Convenience & Exclusivity: Own-brand ranges are exclusive to specific retail networks (such as Tesco, Asda, or Sainsbury’s), fostering customer retention and simplifying the shopping journey.

          Managing Private Labels vs National Brands: The Strategic Challenge

          While inflation created a unique growth window for store brands, long-term success requires active catalog management. As economic conditions fluctuate, consumer preferences shift back and forth between national brands and private labels.

          To maintain market share, retailers must constantly monitor how their private label offerings stack up against comparable products across rival digital storefronts.

          Performance Metric National Brands Private Labels (Own Brand)
          Consumer Perception High brand awareness & trust High value for money & loyalty
          Margin Control Subject to manufacturer pricing Direct control over production & cost
          Catalog Strategy Broad distribution across retailers Exclusive to specific retail networks
          Benchmarking Need Direct SKU-to-SKU matching Cross-attribute matching (weight, specs)

          How Technology Powers Precise Category Benchmarking

          Matching exact SKUs via EAN codes is straightforward when tracking national brands. However, benchmarking private labels against national equivalents—or tracking store brands across different competitors—requires advanced matching algorithms based on functional attributes and volume.

          This is where specialized pricing intelligence technology becomes essential.

          Retail Shake provides retailers with an automated framework to identify comparable products across the entire digital shelf. By analyzing price points, packaging sizes, ingredient profiles, and stock availability across competing supermarket chains, commercial teams gain complete visibility into their market position.

          Executing a structured category benchmark allows Category Managers to align their private label pricing dynamically, protect gross margins, and offer compelling alternatives to national brands.

          Securing Long-Term Growth Beyond Inflation

          Inflation opened a strategic window for private labels to capture market share. However, maintaining that momentum requires continuous optimization rather than passive pricing.

          By leveraging automated tracking for comparable products, retail brands can navigate economic volatility, adjust promotional tactics in real time, and build lasting customer trust. Explore how Retail Shake’s matching engine helps you benchmark private labels against the market.

          E-Commerce Profitability : The Nuances of Pricing Strategy to Win Market Share

          E-Commerce Profitability : The Nuances of Pricing Strategy to Win Market Share

          The Critical Role of Price Adjustments in E-Commerce

          Price optimization is one of the most powerful levers for driving bottom-line profitability in e-commerce. Even a modest retail price adjustment of 5% to 10% on a key SKU can dramatically impact an online retailer’s overall margins.

          To gain initial market share, e-commerce businesses often default to aggressive discount pricing strategies. However, while aiming to be the cheapest player in the market is appealing, it is a dangerous trap that severely erodes profit margins.

          Why is this race-to-the-bottom approach so risky? Squeezing margins leaves online merchants financially vulnerable during intense market downturns or price wars. Furthermore, a sound pricing policy must reinforce the brand’s value proposition and remain consistent over the long term.

          Navigating the complexities of profitable pricing requires strategic guardrails to avoid these common margin traps.

          Pricing Strategies: Balancing Competitiveness and Profitability

          One highly effective tactic is the loss leader strategy. This involves attracting shoppers with low-margin—or even zero-margin—hero products, then capturing profit by bundling or cross-selling higher-margin accessories and related SKUs.

          By pricing key traffic-drivers competitively while maintaining higher margins on secondary items, retailers cultivate a strong “value-for-money” brand perception. When customers experience seamless service, they become far less price-sensitive and less likely to shop around.

          However, executing these e-commerce pricing strategies successfully hinges on building customer trust. Once a shopper is familiar with your site, checkout flow, and delivery speed, switching to an unknown competitor for a minor price difference becomes far less attractive.

          See also: How to Build an Effective E-Commerce Pricing Strategy

          Creating Added Value Beyond Price

          In hyper-competitive markets, competing solely on price is a losing battle. Building true competitive advantage requires differentiation through service quality:

          • Delivering exceptional customer support

          • Offering fast, reliable delivery options

          • Securing exclusive product lines and ranges

          • Adding value through branded perks (e.g., free shipping thresholds or charitable donation pledges)

          At the same time, continuous competitive price tracking remains non-negotiable. Real-time market visibility allows commercial teams to adjust pricing dynamically, counter rival promotions, and make informed strategic moves. Modern price intelligence tools centralize market data, providing live visibility into competitor price shifts, stock availability, and margin health—giving retailers a decisive edge.

          Finally, to fine-tune your approach, test different pricing models during high-volume commercial events like Peak Trading, Black Friday, or seasonal sales. Analyzing performance during these windows helps quantify the exact impact of price adjustments on long-term business growth.

          What Is the Digital Shelf and How Does It Drive Online Sales?

          The digital shelf refers to the sum of all online touchpoints where consumers discover, evaluate, and purchase products. Unlike a traditional brick-and-mortar aisle, the digital shelf is fluid, dynamic, and virtually endless.

          Understanding how your products appear across these digital touchpoints is critical to protecting market share and driving omnichannel growth.

          The Digital Shelf Defined

          Think of the digital shelf as the online equivalent of a physical store display. However, instead of static shelves in a physical aisle, it spans a vast web of connected platforms:

          • Retailer websites: Digital storefronts (e.g., Tesco, Sainsbury’s, Asda) where your items are listed.

          • Direct-to-Consumer (D2C) sites: Your brand’s owned e-commerce channels.

          • Third-party (3P) marketplaces: Major platforms like Amazon or eBay.

          • Mobile shopping apps: Dedicated retailer apps where consumers browse on the go.

          • Social commerce: Social media platforms integrating direct shopping links.

          Historically, shoppers walked into a local store and chose from a limited selection. Today, the buyer’s journey begins with a search query. Whether consumers start on search engines, retail apps, or social media, the buying process has become decentralized and highly competitive.

          Why Brands Need a Strong Digital Shelf Strategy

          Traditional market leaders no longer hold guaranteed prominence online. Emerging brands can compete on equal footing with established names, and the quality of your product data is the deciding factor.

          86% of modern shoppers rely on digital content to make buying decisions, even when completing purchases in physical stores.

          If your products are hidden from online search results, missing key attributes, or priced inconsistently, you risk losing sales, even from customers standing inside a physical store.

          Key Benefits of Optimising Your Online Presence:

          • Increased Share of Voice: Gain maximum visibility in search results across target channels.

          • Higher Conversion Rates: Provide complete, rich product information that drives immediate buying decisions.

          • Brand Trust & Consistency: Ensure smooth messaging, specs, and attributes across every merchant.

          • Competitive Edge: Harness pricing intelligence and monitoring to ensure your product listings remain fully optimized against market rivals.

          The future of retail is omnichannel: physical aisles and digital platforms are now part of a single, interconnected consumer journey.

          See : Marketplace Performance Strategy | Retail Growth Guide

          How Retail Shake Powers Smart Digital Shelf Analytics

          Managing dozens of channels manually is impossible. Retail Shake simplifies digital shelf tracking with a data-driven approach:

          1. Select Your Catalog: Define the exact products and categories you want to monitor.

          2. Choose Your Channels: Pick the specific retailer sites, e-commerce apps, or marketplace platforms you need to track.

          3. Gain Actionable Insights: Receive accurate, normalized data on pricing, stock availability, and attributes to optimize your overall performance.